Traffic congestion in urban areas has become a critical issue in many communities, particularly in large cities such as Manhattan. As a result, we frequently see increased travel times that can impact productivity, environmental health, as well as quality of life. Historical data is what most traffic prediction systems currently rely on but often fail to account for external factors such as accident frequency, road construction, or local patterns such as work-from-home days or special events.
Research on traffic prediction has progressed significantly over the years with many models focusing on different characteristics of traffic flow. Machine learning approaches such as time-series forecasting, neural networks, and decision trees are frequently used in these studies. However, these models commonly overlook the uncertainty/randomness correlated with traffic delays. A more robust approach involves probabilistic models, such as Bayesian Networks. Using a Bayesian Network allows for the model to incorporate uncertainty and randomness into the traffic prediction process.
Some studies, such as the one by Attila Nagy, have used Bayesian networks to model uncommon events such as accidents and road closures. They emphasize how applying probabilistic reasoning to any model can improve the accuracy of predictions during random events. Unfortunately, though, limitations in available datasets and model complexity often restrict their effectiveness in real-time applications.
Problem Statement
The objective of this research is to develop a traffic flow prediction model that incorporates uncertain influences. By leveraging a Bayesian network and historical data provided by The City of New York, this model aims to predict traffic patterns not just based on historical congestion data but by integrating past data on local accidents. This approach seeks to fill the gap left by existing systems, improving traffic management and reducing congestion by enabling more data to be considered when modeling hourly traffic.
Data Collection
This enhanced model seeks to predict congestion more accurately by considering the day of the week, time of day, accident frequency, and prior traffic patterns. This approach will offer a significant improvement over traditional methods that only rely on historical congestion data. By the end of this project, the Bayesian Traffic Prediction model will take into consideration both time-dependent and event-driven factors, providing a more reliable tool for urban traffic
When creating a model like this it is crucial to collect reliable, consistent and easily comprehensive data. However, obtaining datasets that have the amount and consistency required for accurate modeling is challenging. Fortunately, public datasets from the New York City Department of Transportation (NYC DOT) prove plenty of data but no dataset covers a full year in a uniform manner. While the variation in time, date and location of data collection introduces complexity in how the data is merged and preprocessed, the Bayesian Network is well-suited to handle such inconsistencies by incorporating uncertainty and probabilistic reasoning.
For this study, the following publicly available datasets will be utilized:
- NYC DOT Automated Traffic Volume Counts: This dataset uses “ATR Automated Traffic Recorders” to collect traffic sample volume across areas of New York such as Manhattan, Queens and Brooklyn. The dataset contains location, divisions, date, time, congestion volume and more. It is important to note that this dataset does not cover a whole year so the traffic data volume per location will vary from year to year and by region.
- NYPD Motor Vehicle Collision Data: This dataset records detailed accident data, including time, location, contributing factors, and severity. Like the traffic volume dataset, the accident data does vary in coverage and completeness across different time periods and locations.
These datasets will be downloaded, cleaned, and merged to attempt to have some consistency when added to the Bayesian Network. In addition, the data will be preprocessed to align traffic patterns with accident occurrences for the same time periods and geographic locations.
Model Overview: Bayesian Network
A Bayesian Network is a graphical probabilistic model that can be used to represent how variables and their dependencies relate using a directed acyclic graph (DAG). The graphs consist of nodes and edges. A node is the visual representation of the data variables and the edges between/connecting the nodes indicate how those variables are dependent on each other. The strength of these dependencies is quantified by Conditional Probability Distributions (CPDs), which indicate how each child node is conditionally dependent on its parent node(s).
Bayesian Networks can be very useful when modeling systems that contain uncertainty, such as traffic prediction. This is because they allow for probabilistic inference to be made about the model based on given evidence and it can update the predictions dynamically is new data becomes available.
For its application in a traffic prediction model, the Bayesian Network will be capable of handling the uncertainty and randomness that occurs in everyday traffic. Congestion on the road is influenced by a variety of things such as local events, accidents, road closures and more. The Bayesian Network will be able to model these different events are related using probabilistic relationships.
Model Defense: Bayesian Network
For a problem like traffic congestion there are a few models that can be applied to the solution, but the Bayesian Network was selected for the following reasons.
- Incorporation of peripheral data: This approach allows accident data as well as travel time data to be used in the prediction of congestion levels which results in better prediction accuracy. Traditional deterministic models would leave a gap.
- Flexibility: The largest strength of the Bayesian model is the probabilistic flexibility it allows. This is well-suited for handling a variety of uncertainties that cause traffic congestion such as accidents, roadwork and more.
- Dynamic Updates: The Bayesian model structure allows for new data to be added at any point int time.
- Uncertainty Modeling: This model is well-suited when randomness plays a substantial role in prediction.
Outside of a Bayesian model, time-series forecasting using ARIMA is another viable option. This method focuses on identifying historical trends to predict future values and is frequently employed for traffic prediction in research. However, time-series models operate under the assumption that future patterns will closely follow past trends, making them less effective when peripheral data—such as accidents or construction—significantly impacts traffic conditions. Furthermore, unlike Bayesian Networks, time-series models struggle to integrate diverse data sources effectively.
The most common traffic prediction model many of us interact with daily is Google Maps. Google Maps combines live traffic data and predictive modeling to provide dynamic traffic updates. By collecting real-time data from GPS-enabled devices, traffic sensors, and third-party providers such as transportation agencies, Google Maps leverages both live and historical data to identify patterns and apply machine learning algorithms. While Google Maps excels at delivering real-time updates and dynamic routing, the Bayesian Network prediction model has its own distinct advantages. Unlike Google Maps, the Bayesian Network explicitly models uncertainties and dependencies among multiple factors, such as accident severity, time of day, and day of the week. This makes it particularly effective in predicting traffic behavior when data is incomplete or inconsistent. However, the Bayesian model currently lacks real-time incident updates—a limitation that could be addressed in future iterations.
Overall, Bayesian Networks remain an optimal method for traffic prediction due to their ability to effectively integrate diverse data sources, model uncertainty, and adapt flexibly to complex and dynamic traffic scenarios.
Model Construction: Bayesian Network
For this study, the Bayesian Network will model traffic congestion in Manhattan using the variables: day of the week, hour of day, accident severity and congestion level. The resulting model will capture the probabilistic relationship between each variable and will be able to predict the average congestion level in Manhattan based on the day of the week, time and how many accidents have occurred.
Nodes and Variables
As mentioned previously, the nodes in a Bayesian Network represent important variables, in this instance the following variables will be given to the model to be used as nodes:
- Day Of Week: Represents the numerical values for days of the week (0 = Monday, 6 = Sunday).
- Hour: Represents the hour of the day in 24-hour format.
- Accident Level: Represents the severity of accidents, organized into three categories: Low, Medium, and High. These categories are created by grouping the average number of accidents into specific ranges.
- Congestion Level: This is our target variable/node. The congestion level is determined similarly to accident levels using the same three categories and its own unique grouping values.
Edges and Conditional Dependencies
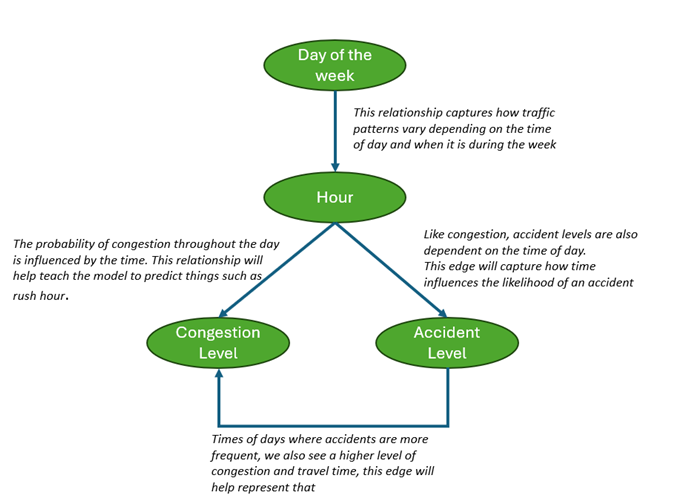
Figure 2: Bayesian Directed Acyclic Graph (DAG)
For the Bayesian Network, the edges will represent conditional dependencies between the above variables. These dependencies will teach the model how each node influences the other. The structure of edges is shown in Figure 2 and explained as follows:
- Hour is dependent on Day of Week: This relationship captures how traffic patterns vary depending on the time of day and when it is during the week.
- Congestion Level is dependent on Hour: The probability of congestion throughout the day is influenced by the time. This relationship will help teach the model to predict things such as rush hour.
- Accident Level is depended on Hour: Like congestion, accident levels are also dependent on the time of day. Certain times such as late at night on the weekend might be more accident prone. This edge will capture how time influences the likelihood of an accident.
Congestion Level is dependent on Accident Level: Accidents have a significant affect on the amount of congestion in an area. Times of days where accidents are more frequent, we also see a higher level of congestion and travel time, this edge
Results
Review Video for results. 🙂